# Using Ultrafeeder with Grafana and Prometheus
[`Grafana`](https://grafana.com/) is an analytics platform that can provide alternative graphs for `readsb`.
In this guide we will be using [`Prometheus`](https://prometheus.io/) as the data repository.
Using Grafana and Prometheus in this configuration does not require a plan, account, or credentials for their respective cloud offerings.
## Hardware requirements
Prometheus will store a lot of data, and Grafana will do a lot of data queries. As a result, it would be better if you run these containers on a different system than your feeder Raspberry Pi. This will leave your Pi focused on data collection and processing, and unbothered by the CPU and Disk IO load that Prometheus/Grafana will cause.
You *can* do it on a single system. We're assuming below that you are not. If you do it on a single system, then you can combine the `docker-compose.yml` components in a single file
## Step 1: Make Prometheus data available for the Ultrafeeder
- Edit your Ultrafeeder's `docker-compose.yml` file and ensure that the following is set for the `ultrafeeder` service:
```yaml
environment:
- PROMETHEUS_ENABLE=true
- TAR1090_ENABLE_AC_DB=true
ports:
- 9273-9274:9273-9274
```
Now recreate the ultrafeeder container (`docker-compose up -d ultrafeeder`) and it will generate Prometheus data.
## Step 2: create a container stack for `prometheus` and `grafana`
On the machine where you will run Prometheus and Grafana, create a docker-compose file in the `/opt/grafana` directory:
```bash
sudo mkdir -p -m777 /opt/grafana/grafana/appdata /opt/grafana/prometheus/config /opt/grafana/prometheus/data
cd /opt/grafana
cat > docker-compose.yml
```
Now paste in the following text *):
<‐‐ Click the arrow to see the docker-compose.yml text
```yaml
version: '3.9'
volumes:
grafana:
driver: local
driver_opts:
type: none
device: "/opt/grafana/grafana/appdata"
o: bind
prom-config:
driver: local
driver_opts:
type: none
device: "/opt/grafana/prometheus/config"
o: bind
prom-data:
driver: local
driver_opts:
type: none
device: "/opt/grafana/prometheus/data"
o: bind
services:
grafana:
image: grafana/grafana-oss:latest
restart: unless-stopped
container_name: grafana
hostname: grafana
tty: true
# uncomment the following section and set the variables if you are exposing Grafana to the internet behind a rev web proxy:
environment:
# windrose panel plugin is needed for polar plots:
- GF_INSTALL_PLUGINS=fatcloud-windrose-panel
# uncomment and set the following variables if you are exposing Grafana to the internet behind a rev web proxy:
# - GF_SERVER_ROOT_URL=https://mywebsite.com/grafana/
# - GF_SERVER_SERVE_FROM_SUB_PATH=true
ports:
- 3000:3000
volumes:
- grafana:/var/lib/grafana
prometheus:
image: prom/prometheus
container_name: prometheus
hostname: prometheus
restart: unless-stopped
tmpfs:
- /tmp
volumes:
- prom-config:/etc/prometheus
- prom-data:/prometheus
ports:
- 9090:9090
```
*) The volume definition structure is written this way purposely to ensure that the containers can place files in the persistent directories. Do not try to "directly" map volumes (`/opt/grafana/grafana/appdata:/var/lib/grafana`).
You should be able to see the following directories:
- `/opt/grafana/grafana/appdata`
- `/opt/grafana/prometheus/config`
- `/opt/grafana/prometheus/data`
Download and create Grafana and Prometheus for the first time with this command:
```bash
docker compose up -d
```
## Step 3: Configuring Prometheus
Prometheus needs to be told where to look for the data from the ultrafeeder. We will create a target prometheus configuration file that does this, please copy and paste the following. Make sure to replace `ip_of_ultrafeeder_machine` with the IP address or hostname of the machine where `ultrafeeder` is running:
```bash
docker exec -it prometheus sh -c "echo -e \" - job_name: 'readsb'\n static_configs:\n - targets: ['ip_of_ultrafeeder_machine:9273', 'ip_of_ultrafeeder_machine:9274']\" >> /etc/prometheus/prometheus.yml"
docker stop prometheus
docker compose up -d
```
(If you screw this up, **do NOT** re-run the command. Instead, try `sudo nano /opt/grafana//prometheus/config/prometheus.yml` and fix it that way.)
## Accessing Prometheus and Grafana via your browser
You should be able to point your web browser at:
* `http://docker.host.ip.addr:9090/` to access the `prometheus` console.
* `http://docker.host.ip.addr:3000/` to access the `grafana` console, use admin/admin as initial credentials, you should be prompted to change the password on first login.
Remember to change `docker.host.ip.addr` to the IP address of your docker host.
## Configuring data source and dashboard in Grafana
After you have logged into the `grafana` console the following manual steps are required to connect to `prometheus` as the data source
1. Click `Add your first data source` in the main panel
2. Click `Prometheus` from the list of options provided
3. Input or select the following options, if the option is not listed, do not input anything for that option:
Option | Input
------------- | -------------
Name | readsb
URL | http://prometheus:9090/
Clicking `Save & Test` should return a green message indicating success. The dashboard can now be imported with the following steps
1. Hover over the `four squares` icon in the sidebar, click `+ Import`
2. Enter `18398` into the `Import via grafana.com` section and click `Load`
3. Select `readsb` from the bottom drop down list
4. Click `Import` on the subsequent dialogue box
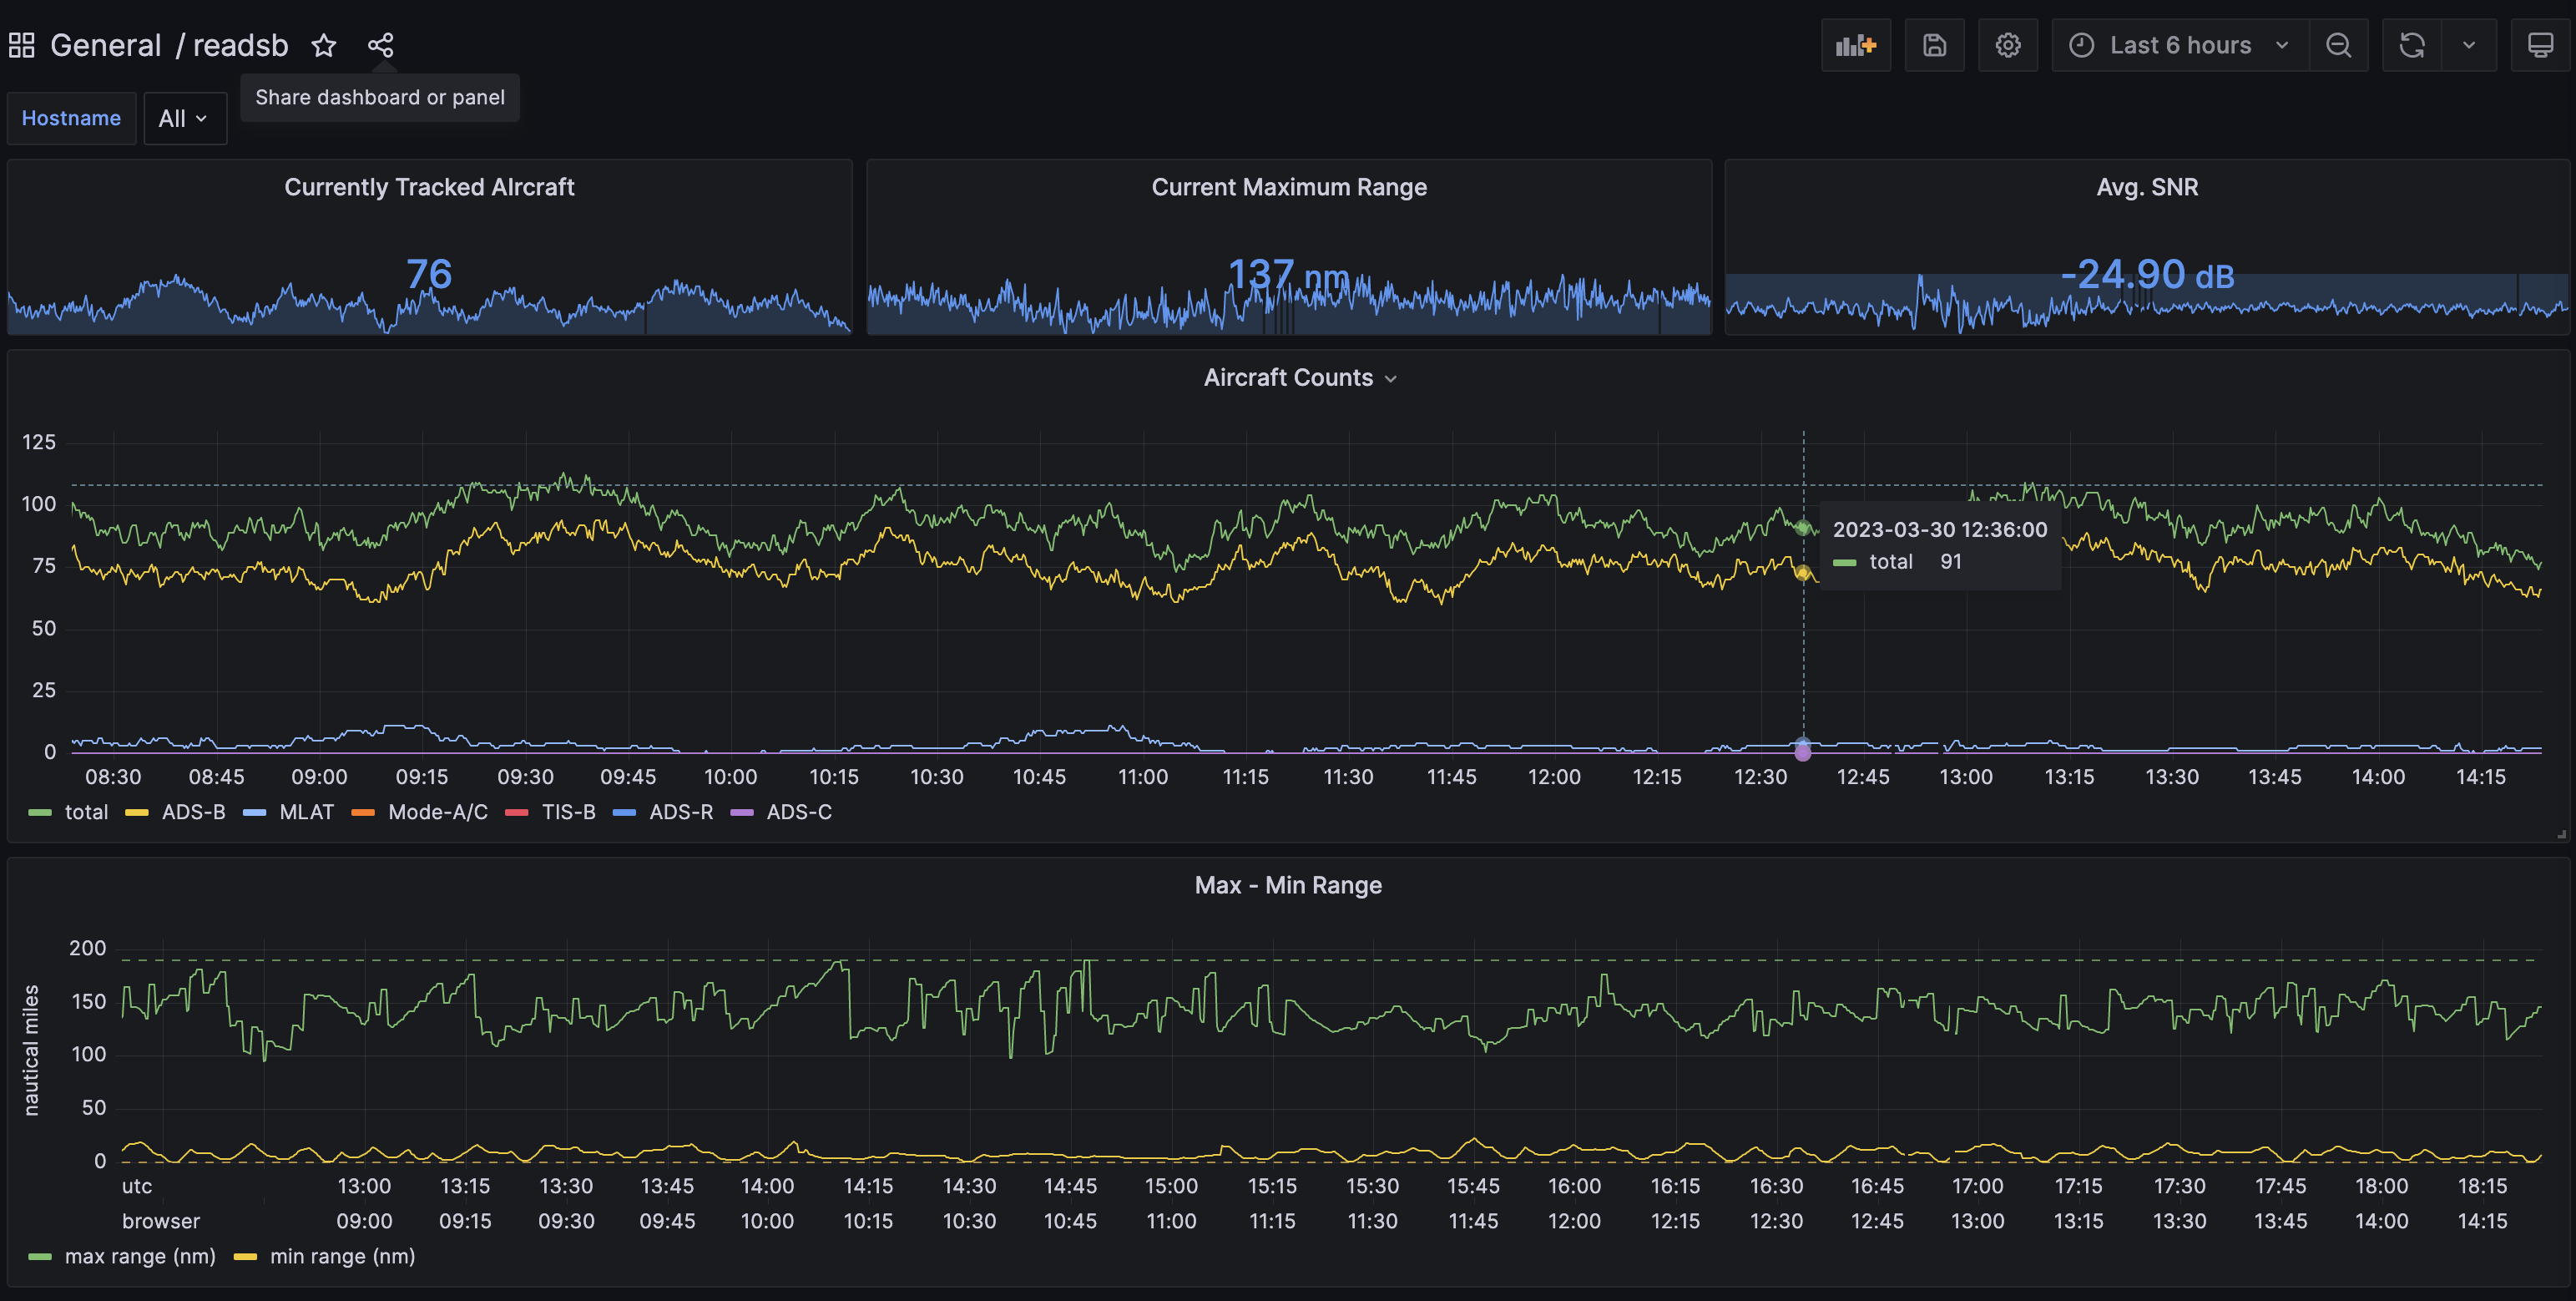
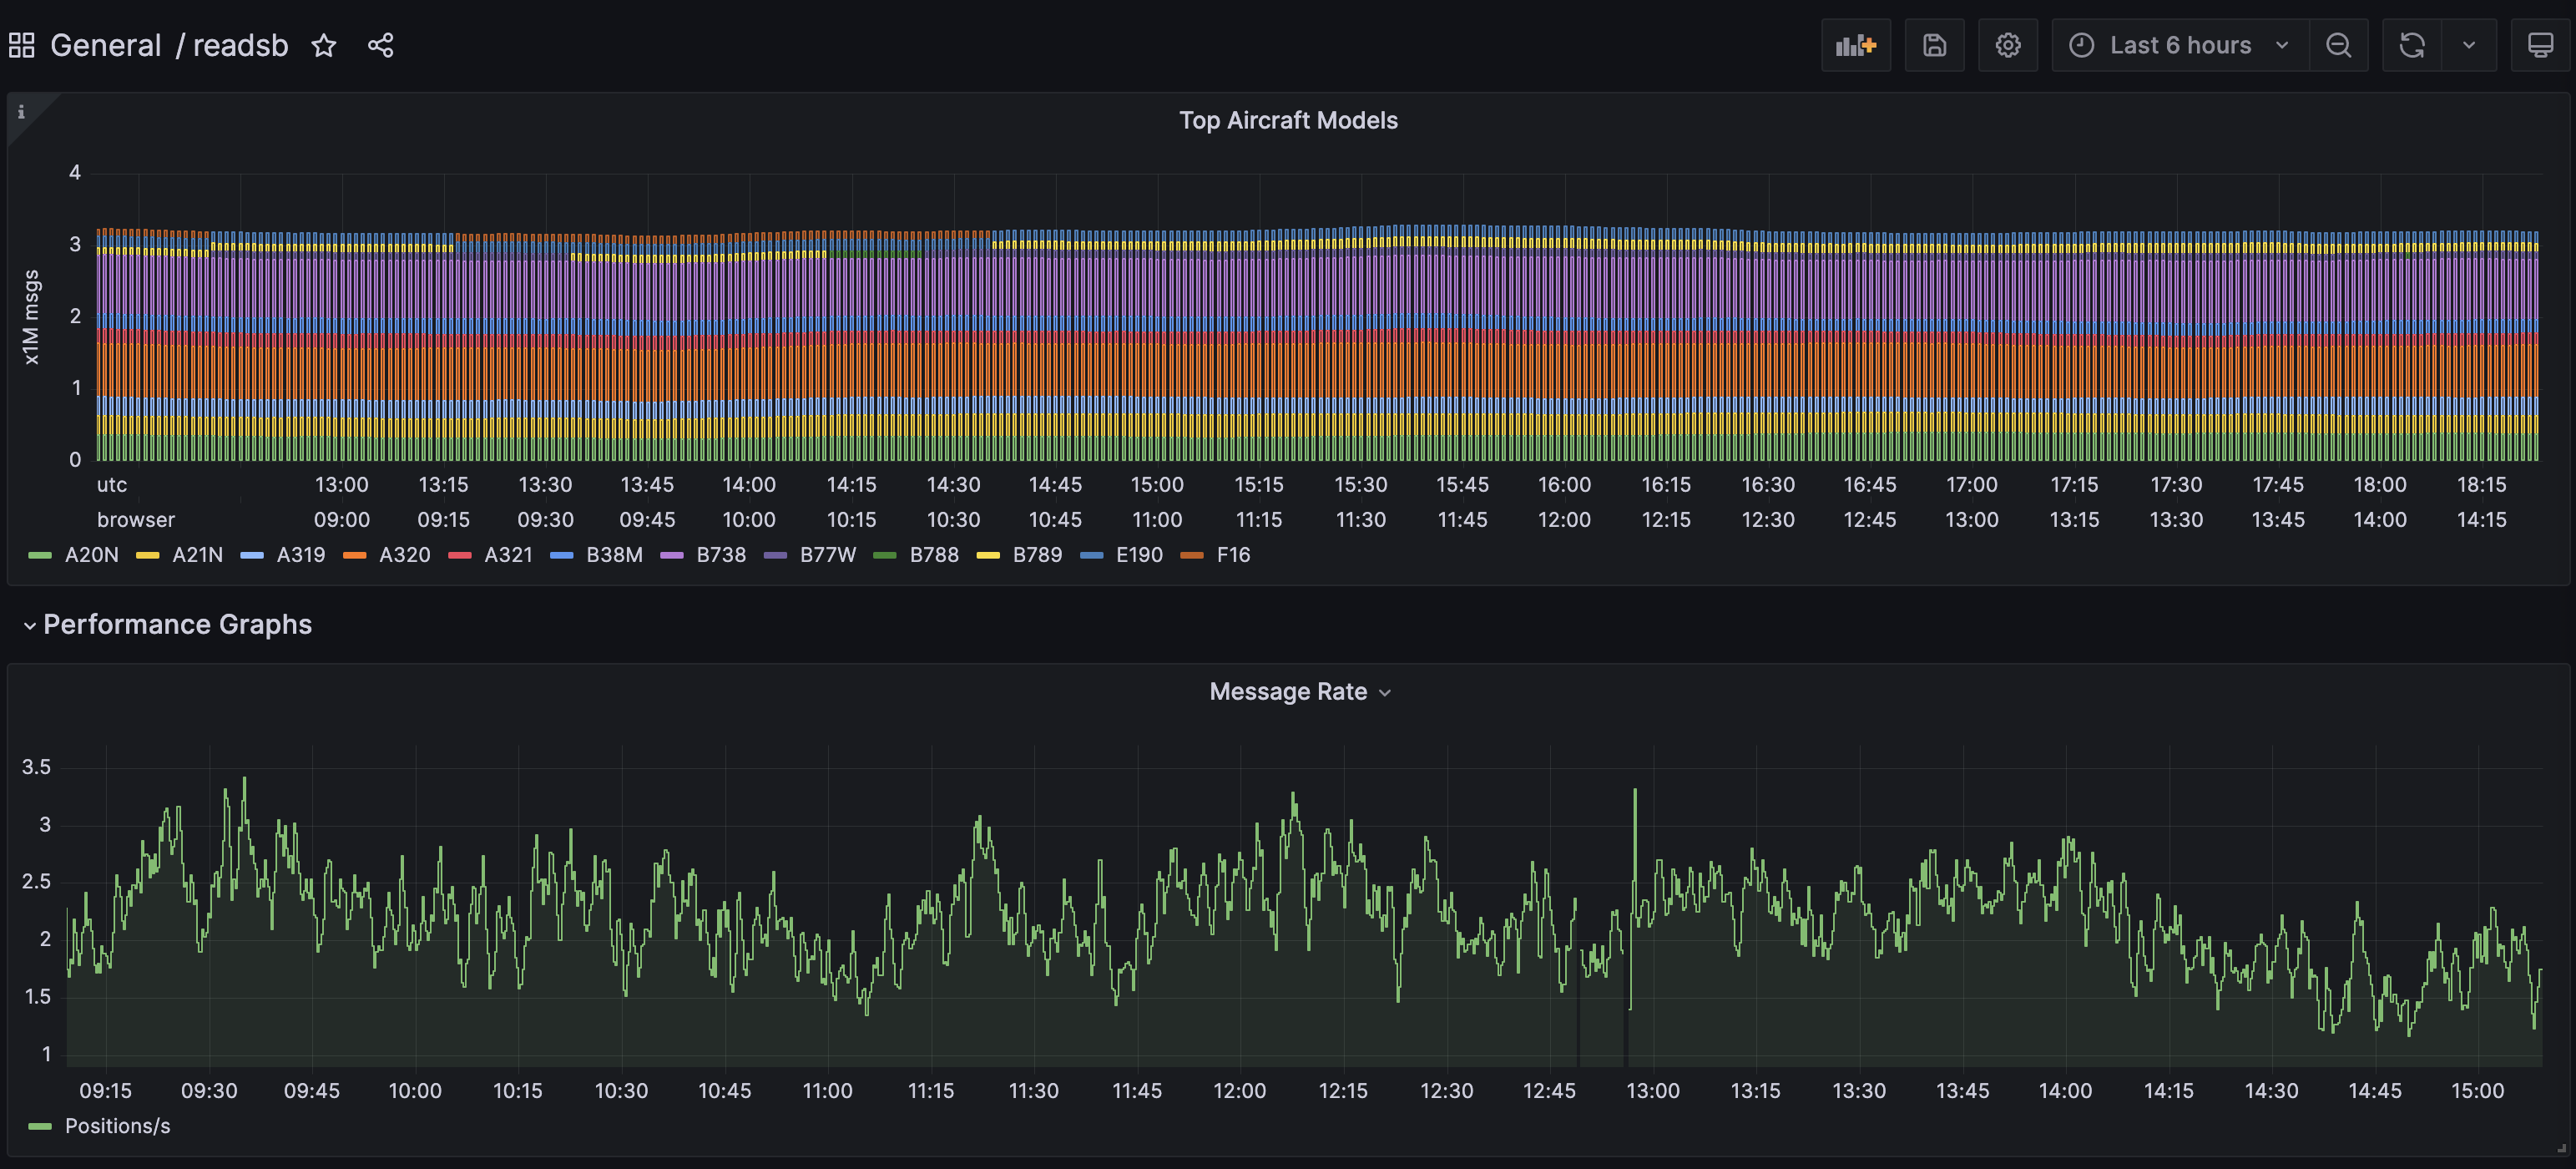
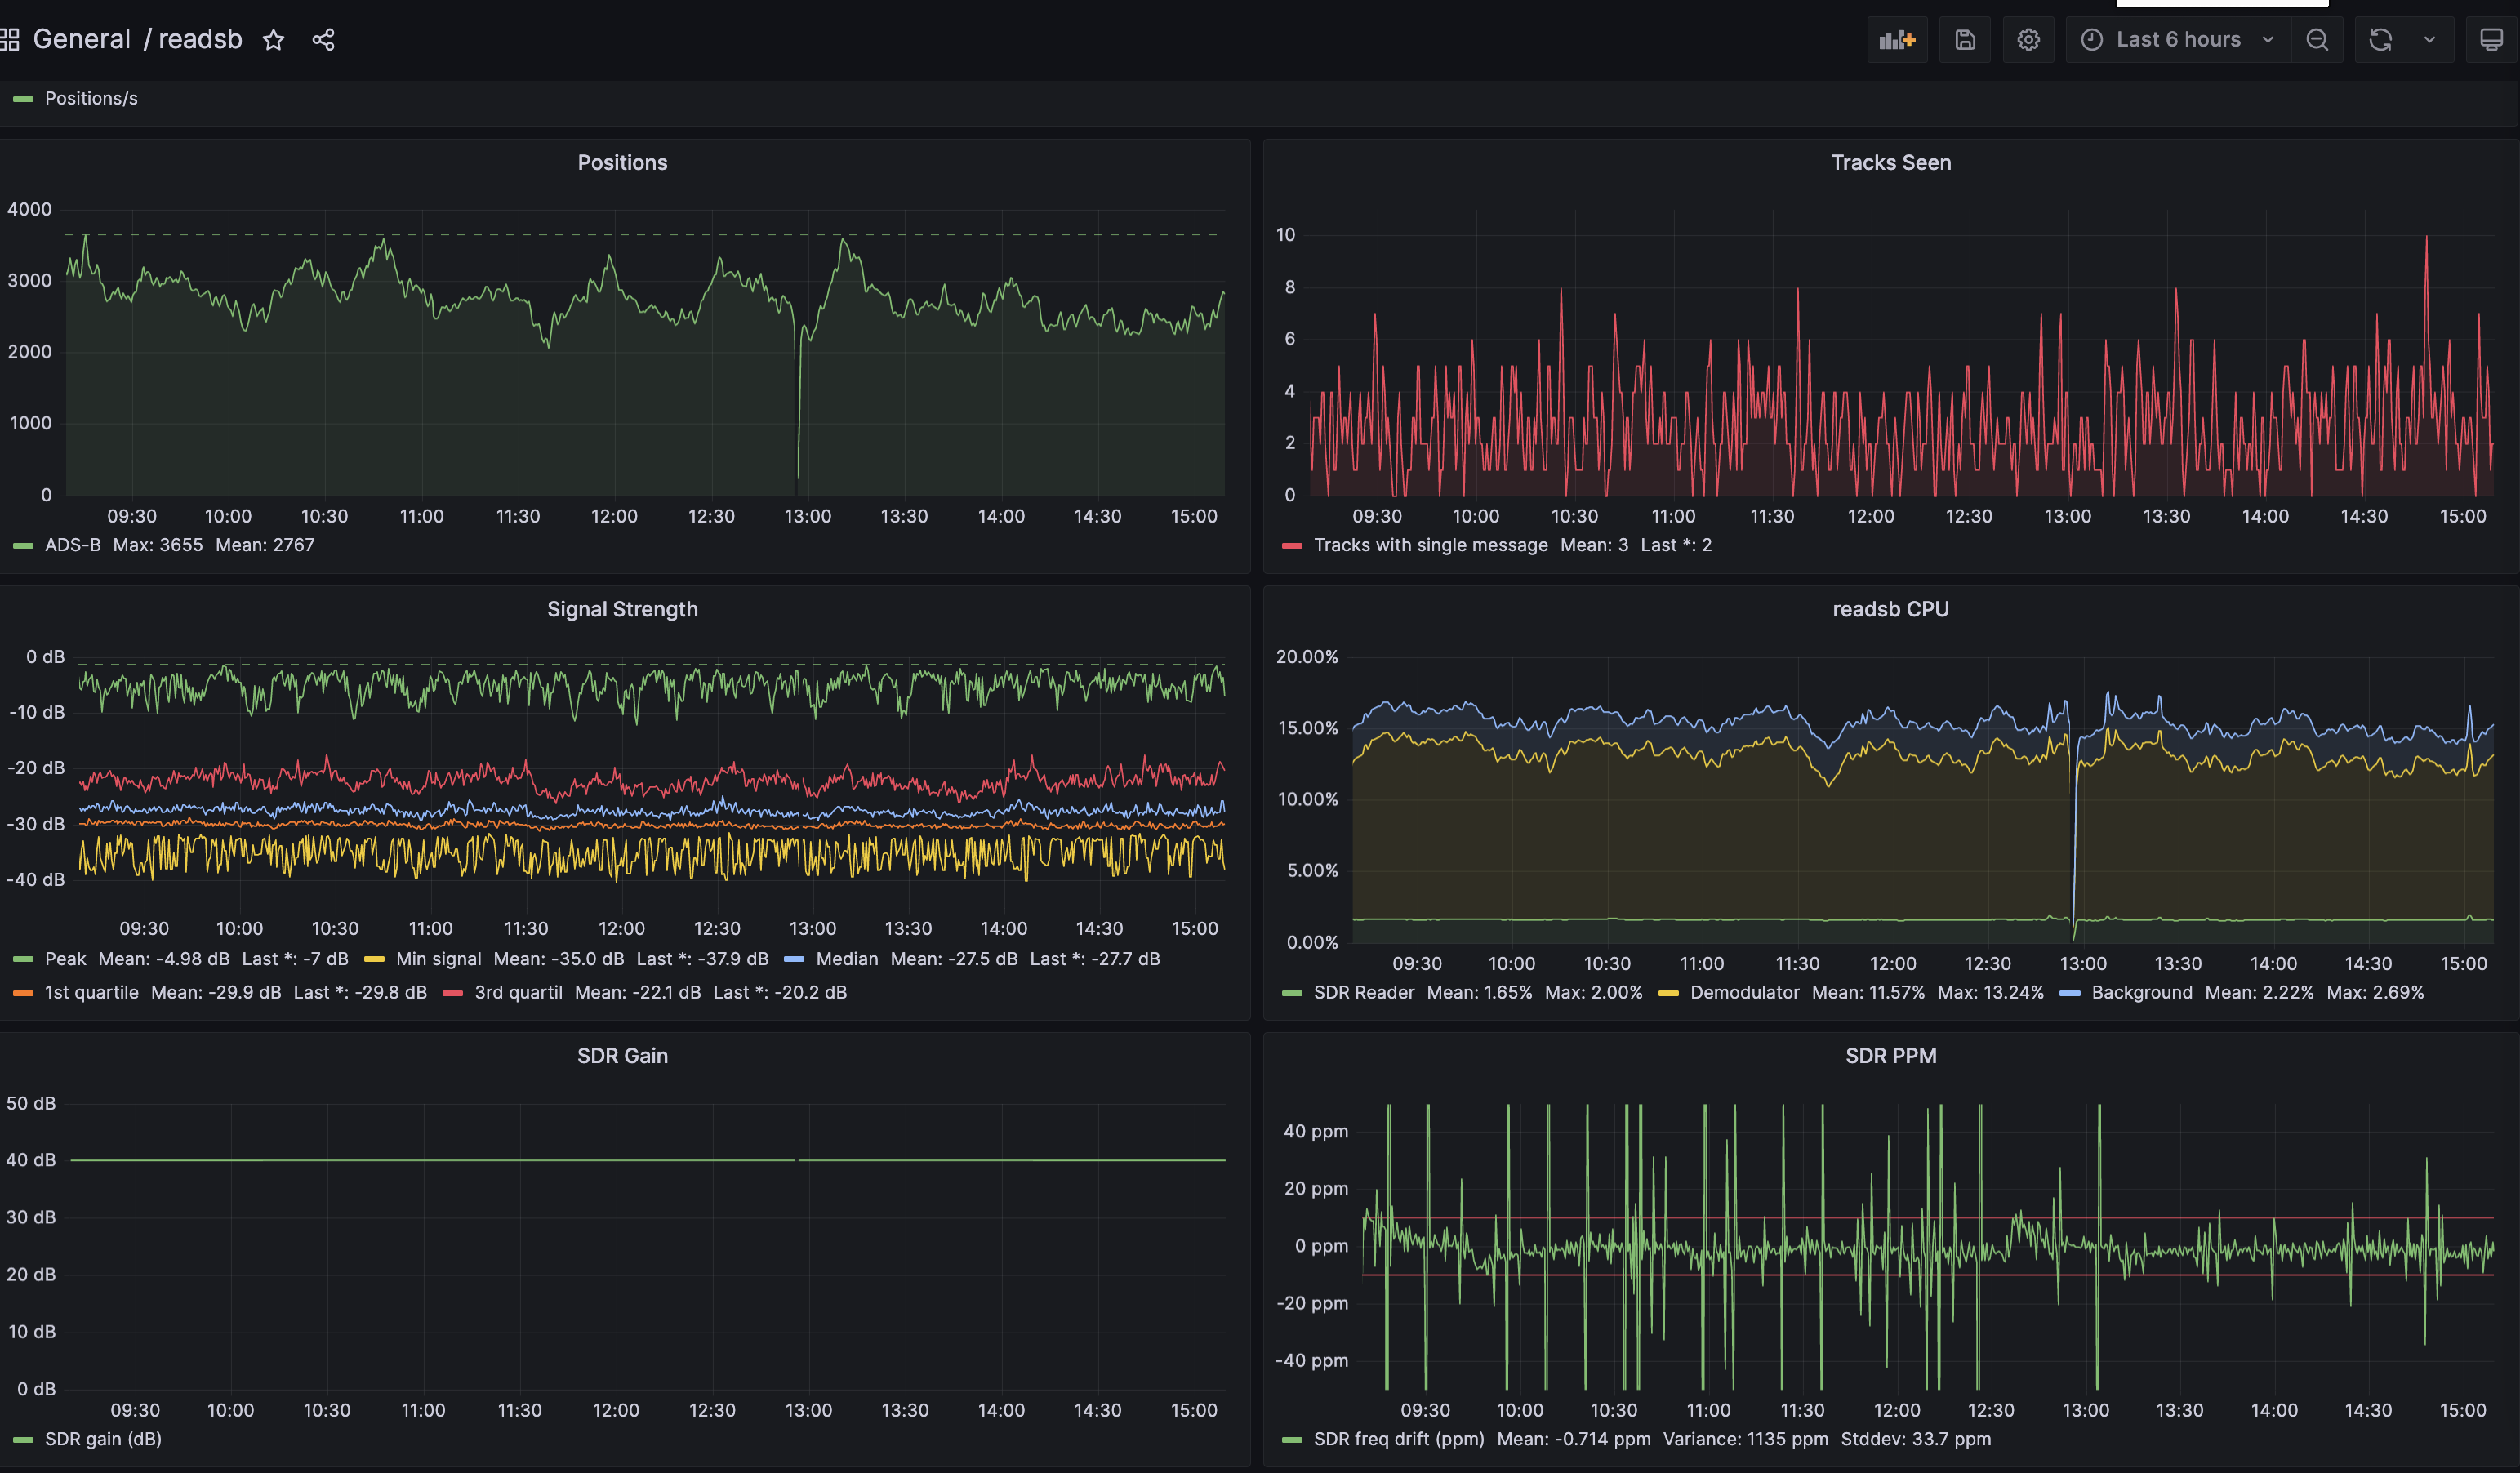
At this point you should see a very nice dashboard, you can find it under `General` in the `Dashboards` section.