1
0
Fork 0
mirror of https://github.com/sdr-enthusiasts/docker-adsb-ultrafeeder.git synced 2024-10-16 05:50:44 +00:00
docker-adsb-ultrafeeder/README-grafana.md

224 lines
10 KiB
Markdown
Raw Normal View History

2023-03-30 19:18:53 +00:00
# Using Ultrafeeder with Grafana and Prometheus
[`Grafana`](https://grafana.com/) is an analytics platform that can provide alternative graphs for `readsb`.
In this guide we will be using [`Prometheus`](https://prometheus.io/) as the data repository.
Using Grafana and Prometheus in this configuration does not require a plan, account, or credentials for their respective cloud offerings.
## Hardware requirements
Prometheus will store a lot of data, and Grafana will do a lot of data queries. As a result, it would be better if you run these containers on a different system than your feeder Raspberry Pi. This will leave your Pi focused on data collection and processing, and unbothered by the CPU and Disk IO load that Prometheus/Grafana will cause.
You *can* do it on a single system. We're assuming below that you are not. If you do it on a single system, then you can combine the `docker-compose.yml` components in a single file
## Step 1: Make Prometheus data available for the Ultrafeeder
- Edit your Ultrafeeder's `docker-compose.yml` file and ensure that the following is set for the `ultrafeeder` service:
```yaml
environment:
- PROMETHEUS_ENABLE=true
- TAR1090_ENABLE_AC_DB=true
2023-03-30 19:18:53 +00:00
ports:
- 9273-9274:9273-9274
```
Now recreate the ultrafeeder container (`docker-compose up -d ultrafeeder`) and it will generate Prometheus data.
## Step 2: create a container stack for `prometheus` and `grafana`
On the machine where you will run Prometheus and Grafana, create a docker-compose file in the `/opt/grafana` directory:
```bash
2023-03-30 21:45:32 +00:00
sudo mkdir -p -m777 /opt/grafana/grafana/appdata /opt/grafana/prometheus/config /opt/grafana/prometheus/data
2023-03-30 20:19:16 +00:00
cd /opt/grafana
2023-03-30 19:18:53 +00:00
cat > docker-compose.yml
```
2023-03-30 20:14:38 +00:00
Now paste in the following text *):
2023-03-30 19:18:53 +00:00
<details>
2023-03-30 19:27:08 +00:00
<summary>&lt;&dash;&dash; Click the arrow to see the <code>docker-compose.yml</code> text</summary>
2023-03-30 19:18:53 +00:00
```yaml
version: '3.9'
2023-03-30 20:14:38 +00:00
volumes:
grafana:
driver: local
driver_opts:
type: none
device: "/opt/grafana/grafana/appdata"
o: bind
prom-config:
driver: local
driver_opts:
type: none
device: "/opt/grafana/prometheus/config"
o: bind
prom-data:
driver: local
driver_opts:
type: none
device: "/opt/grafana/prometheus/data"
o: bind
2023-03-30 19:18:53 +00:00
services:
grafana:
image: grafana/grafana-oss:latest
restart: unless-stopped
container_name: grafana
hostname: grafana
tty: true
# uncomment the following section and set the variables if you are exposing Grafana to the internet behind a rev web proxy:
environment:
# windrose panel plugin is needed for polar plots:
2023-04-25 02:27:14 +00:00
- GF_INSTALL_PLUGINS=snuids-radar-panel,fatcloud-windrose-panel
# uncomment and set the following variables if you are exposing Grafana to the internet behind a rev web proxy:
# - GF_SERVER_ROOT_URL=https://mywebsite.com/grafana/
2023-03-30 19:18:53 +00:00
# - GF_SERVER_SERVE_FROM_SUB_PATH=true
2023-04-25 02:27:14 +00:00
# The following variables are needed if you want to expose and embed any dashboards publicly:
# - GF_AUTH_ANONYMOUS_ENABLED=true
# - GF_AUTH_ANONYMOUS_ORG_NAME=public
# - GF_SECURITY_ALLOW_EMBEDDING=true
# - GF_PANELS_DISABLE_SANITIZE_HTML=true
# - GF_FEATURE_TOGGLES_ENABLE=publicDashboards
# The following variables will allow you to "share/render" dashboards as PNG graphics.
# You should also enabled the renderer container below.
# - GF_RENDERING_SERVER_URL=http://renderer:8081/render
# - GF_RENDERING_CALLBACK_URL=http://grafana:3000/
# - GF_LOG_FILTERS=rendering:debug
2023-03-30 19:18:53 +00:00
ports:
- 3000:3000
volumes:
2023-03-30 20:14:38 +00:00
- grafana:/var/lib/grafana
2023-03-30 19:18:53 +00:00
2023-04-25 02:27:14 +00:00
# The `renderer` container is needed if you want to share images of your dashboard as a graphic:
renderer:
image: grafana/grafana-image-renderer:latest
2023-03-30 19:18:53 +00:00
prometheus:
image: prom/prometheus
container_name: prometheus
hostname: prometheus
restart: unless-stopped
tmpfs:
- /tmp
volumes:
2023-03-30 20:14:38 +00:00
- prom-config:/etc/prometheus
- prom-data:/prometheus
2023-03-30 19:18:53 +00:00
ports:
- 9090:9090
```
</details>
2023-03-30 20:19:16 +00:00
*) The volume definition structure is written this way purposely to ensure that the containers can place files in the persistent directories. Do not try to "directly" map volumes (`/opt/grafana/grafana/appdata:/var/lib/grafana`).
2023-03-30 19:18:53 +00:00
2023-03-30 20:19:16 +00:00
You should be able to see the following directories:
2023-03-30 19:18:53 +00:00
- `/opt/grafana/grafana/appdata`
- `/opt/grafana/prometheus/config`
- `/opt/grafana/prometheus/data`
2023-03-30 20:14:38 +00:00
Download and create Grafana and Prometheus for the first time with this command:
2023-03-30 19:27:08 +00:00
2023-03-30 19:18:53 +00:00
```bash
2023-03-30 20:14:38 +00:00
docker compose up -d
2023-03-30 19:18:53 +00:00
```
2023-03-30 20:14:38 +00:00
## Step 3: Configuring Prometheus
2023-03-30 19:27:08 +00:00
2023-04-25 02:27:14 +00:00
Prometheus needs to be told where to look for the data from the ultrafeeder. We will create a target prometheus configuration file that does this, please copy and paste the following. Make sure to replace `ip_xxxxxxx` with the IP address or hostname of the machine where `ultrafeeder` is running:
2023-03-30 19:18:53 +00:00
2023-03-30 20:14:38 +00:00
```bash
2023-04-25 02:27:14 +00:00
docker exec -it prometheus sh -c "echo -e \" - job_name: 'ultrafeeder'\n static_configs:\n - targets: ['ip_xxxxxxx:9273', 'ip_xxxxxxx:9274']\" >> /etc/prometheus/prometheus.yml"
2023-03-30 20:14:38 +00:00
docker stop prometheus
docker compose up -d
```
2023-03-30 19:18:53 +00:00
2023-03-30 20:14:38 +00:00
(If you screw this up, **do NOT** re-run the command. Instead, try `sudo nano /opt/grafana//prometheus/config/prometheus.yml` and fix it that way.)
2023-03-30 19:18:53 +00:00
2023-03-30 20:14:38 +00:00
## Accessing Prometheus and Grafana via your browser
2023-03-30 19:18:53 +00:00
2023-03-30 20:14:38 +00:00
You should be able to point your web browser at:
2023-03-30 19:18:53 +00:00
2023-04-18 18:16:23 +00:00
- `http://docker.host.ip.addr:9090/` to access the `prometheus` console.
- `http://docker.host.ip.addr:3000/` to access the `grafana` console, use admin/admin as initial credentials, you should be prompted to change the password on first login.
2023-03-30 19:18:53 +00:00
Remember to change `docker.host.ip.addr` to the IP address of your docker host.
## Configuring data source and dashboard in Grafana
After you have logged into the `grafana` console the following manual steps are required to connect to `prometheus` as the data source
1. Click `Add your first data source` in the main panel
2. Click `Prometheus` from the list of options provided
3. Input or select the following options, if the option is not listed, do not input anything for that option:
Option | Input
------------- | -------------
2023-04-25 02:27:14 +00:00
Name | ultrafeeder
2023-04-18 18:16:23 +00:00
URL | `http://prometheus:9090/`
2023-03-30 19:18:53 +00:00
Clicking `Save & Test` should return a green message indicating success. The dashboard can now be imported with the following steps
1. Hover over the `four squares` icon in the sidebar, click `+ Import`
2. Enter `18398` into the `Import via grafana.com` section and click `Load`
2023-04-25 02:27:14 +00:00
3. Select `ultrafeeder` from the bottom drop down list
2023-03-30 19:18:53 +00:00
4. Click `Import` on the subsequent dialogue box
At this point you should see a very nice dashboard, you can find it under `General` in the `Dashboards` section.
2023-04-25 02:27:14 +00:00
## Advanced Configuration: support for dashboards for multiple ultrafeeder instances
If you have multiple feeder stations with multiple instances of `ultrafeeder`, you can configure a dashboard for each of them. Here's how. In our example, we have two `ultrafeeder` instance called `heerlen` and `trenton`. You can adjust these names in accordance with your needs.
First execute all steps above, and then continue here.
2023-04-25 02:35:05 +00:00
### Step 1: Edit your Prometheus config file so the `job_name`s look like this
2023-04-25 02:27:14 +00:00
```yaml
- job_name: 'heerlen'
static_configs:
- targets: ['10.0.0.100:9273', '10.0.0.100:9274']
- job_name: 'trenton'
static_configs:
- targets: ['10.0.0.101:9273', '10.0.0.101:9274']
```
Here, `10.0.0.100` is the IP address of the `heerlen` station, and `10.0.0.101` is the IP address of the `trenton` station. Yours will be different. Please keep the ports as you mapped them for Ultrafeeder in each instance. You should have a `- job_name` block for each ultrafeeder instance.
You can remove the `ultrafeeder` section as it will probably be a duplicate of what you just created.
Once you are done editing, restart Prometheus (`docker restart prometheus`).
### Step 2: Change your initial Grafana dashboard to use the new job name
In the previous step, you replaced the `ultrafeeder` job name by two or more new names. Now, we need to create a copy of the dashboard for each of the job names and make sure they each use the data source from the correct `ultrafeeder` instance.
2023-04-25 02:35:05 +00:00
- Step 2a: Log into Grafana and open the Ultrafeeder dashboard that you already created
- Step 2b: Click on the cogwheel (`Dashboard Settings`) in the top of the screen
- Step 2c: Choose `JSON Model` from the Setting menu on the left of the screen and click anywhere in the JSON text
- Step 2d. Press CTRL-F (Window/Linux) or CMD-F (Mac) and press the `>` button to show Find and Replace:<br />![image](https://user-images.githubusercontent.com/15090643/234160327-7997cfec-8726-4974-a125-859f4f16f6b7.png)
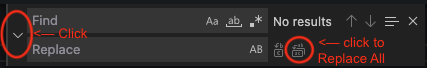
- Step 2e: Find all instances of `job=\"ultrafeeder\"` and replace them with `job=\"heerlen\"` (or whatever name your first feeder has)
- Step 2f: Press `Save dashboard` at the top right of the screen, followed by `Save` on the next screen
- Step 2g: Press ESC to go back to your dashboard
2023-04-25 02:27:14 +00:00
Now your first Grafana dashboard gets its data from the your first `ultrafeeder` instance.
### Step 3: Clone the dashboard and repoint it at your second `ultrafeeder` instance
If you followed the steps above, you should be at your updated (first) dashboard. We'll now clone and adapt it for your second `ultrafeeder` instance:
2023-04-25 02:35:05 +00:00
- Step 3a: Press the `Share` icon (to the right of the star, next to the page title)
- Step 3b: Click the `Export` tab. Switch on `Export for sharing externally`
- Step 3c: Press `View JSON` and `Copy to Clipboard`
- Step 3d: `X` out of the popup box, leave the Dashboard, and go back to the `Browse Dashboards` page.
- Step 3e: Click `New` -> `Import`. Right-click in the `Import via panel json` box, and paste your clipboard. Press `Load`
- Step 3f: Change the `Name` and `uid` (pick anything you want), and select `Prometheus` as data source. IMPORTANT: if you do not change the `Name` and `uid`, it will overwrite your existing dashboard. CHANGE BOTH OF THEM! Then press `Import`
- Step 3g: You will see your new dashboard, but it's still getting data from your first one. Follow steps 2b - 2g above to change the data source from `heerlen` (or whatever you named it) to `trenton` (or whatever name you want to give to it)
2023-04-25 02:27:14 +00:00
Now you have 2 dashboards for 2 instances of Ultrafeeder!